Demographics
Black Population in England and Wales
National, regional and local population patterns using official data where verified.

Black population
2,409,283England and Wales, Census 2021.
Share of population
4.0%England and Wales, Census 2021.
Population change
+0.5M2011 to 2021, England and Wales. Source table verification required for local use.
Population by Region
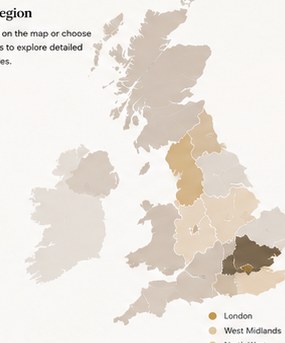
Boundary source: ONS Open Geography Portal. Regional values withheld until matched to verified ethnicity tables.
Age Profile
Age bands are derived from the existing project age-distribution page and must keep its methodology notes.
Regional Explorer
| Region | Code | Status | View |
|---|---|---|---|
| London | E12000007 | Source match needed before publishing regional value | View profile -> |
| West Midlands | E12000005 | Source match needed before publishing regional value | View profile -> |
| North West | E12000002 | Source match needed before publishing regional value | View profile -> |
| South East | E12000008 | Source match needed before publishing regional value | View profile -> |
DescriptionPopulation data on Black British communities in England and Wales. Census 2021 figures on size, regional distribution, and demographic breakdown.
Black British Sub-groups — England & Wales (2021)
Black British as % of Regional Population — England & Wales (2021)
Population — UK Black Demographics | BlackBritish.org.uk
ONS Census 2021, Table TS021
people identified as Black or Black British in England and Wales in the 2021 Census — 3.2% of the total population.
The Black British population grew by approximately
35%
between the 2011 and 2021 Censuses, driven primarily by growth in the Black African sub-group.
ONS Census 2021, Table TS021 by region
regionLondon
regionWest Midlands
regionSouth East
regionEast of England
regionNorth West
regionEast Midlands
labelPopulation Size
labelRegional Distribution
labelAge Profile
labelSources
labelSee our methodology
urlhttps://www.ons.gov.uk/census/census2021results/topicbasedprofiles
labelAge by ethnic group
nameCensus 2021, Table TS007A
labelScotland
nameScotland's Census 2022
labelNorthern Ireland
nameNISRA Census 2021
labelView age distribution data tool
labelPopulation size & sub-groups
noteEthnic group, England & Wales
labelAge distribution (pending)
nameONS Census 2021, Table TS007A
recharts
Black African
Black Caribbean
Black Other
description
canonical
robots
noindex, follow
Data Topic · Population
Population
Demographic data on the Black British population across England and Wales, drawn from the ONS Census 2021. Figures cover population size, regional distribution, and sub-group breakdown.
Population figures are drawn from ONS Census 2021, Table TS021. Age distribution data is under verification against Table TS007A.
1.9m
Black British people
England & Wales, 2021
3.2%
of total population
Census 2021, TS021
13.5%
of London population
Census 2021, regional
2011→2021
Population grew +35%
Census comparison
text-center sm:text-left
size
Population Size & Sub-groups
The Black or Black British population of England and Wales stood at approximately 1,898,000 in the 2021 Census — 3.2% of the total population of 59.6 million. This represents a 35% increase from the 2011 Census figure of approximately 1,405,000.
1,024,000
1.7% of England & Wales population · Census 2021
594,000
1.0% of England & Wales population · Census 2021
280,000
0.5% of England & Wales population · Census 2021
100%
vertical
3 3
number
category
group
1px solid hsl(var(–border))
value
Total Black British population
text-foreground
Growth since 2011
regions
The Black British population is heavily concentrated in London, which accounts for the majority of the national total. Outside London, the West Midlands and South East have the next largest concentrations.
dataKey=
label=
sub=
title=
intro=
s Census 2022", url:
, name:
, url:
, label:
, note:
, name: "Scotland